.svg)
.svg)
“What gets measured gets managed” — or so say today’s business leaders. But, the second half of management guru Peter Drucker’s famous line often gets forgotten:
“What gets measured gets managed — even when it’s pointless to measure and manage it, and even if it harms the purpose of the organization to do so.”
Measurements matter. But, choosing the right thing to measure makes all the difference.
It’s especially important for utility worker safety, when lives and limbs are on the line. So, what are the most important worker safety KPIs? What factors should utilities track to ensure they’re doing their best to keep workers safe?
Here’s a roundup of key indicators that, time and again, worker safety experts say utilities should keep an eye on.
The Top KPIs for Improving Worker Safety in the Utilities
Worker Safety KPI #1: Serious Injuries and Fatalities (SIFs)
Today, serious injuries and fatalities (SIFs) is the KPI on top of utility safety managers’ minds. In previous years, EH&S programs may have focused on tracking and preventing total injuries, but SIFs have now taken the lead.
“The industry is shifting toward a SIF-oriented operating model,” says David Preston, VP of Product at Urbint.
“Total recordable incident rate (TRIR) is, historically, a metric that people oriented around, but over the past 10 years the industry has successfully been able to drive that down. Now we’re seeing a transition to SIF-focused programs that target those high-consequence injuries.”
It follows, as the utilities still have a SIF exposure rate of 32% — seven points higher than the all-industry average. With TRIR falling, utilities should dial in their focus on serious injuries and fatalities to improve their safety record.
“SIFs are the incidents that change the lives of workers and their families,” says Preston.
Worker Safety KPI #2: Potential Serious Injuries or Fatalities (PSIFs)
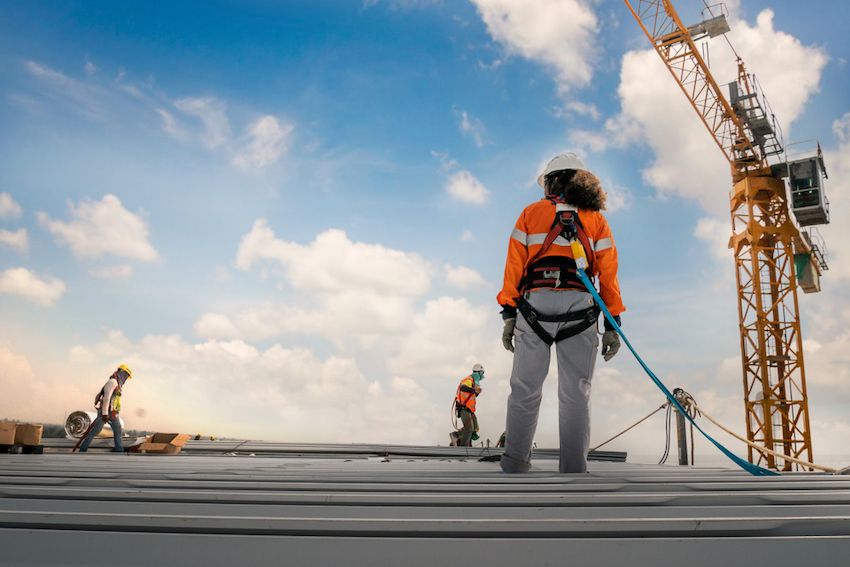
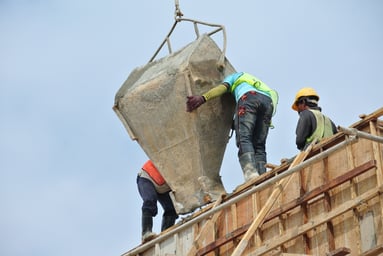 Working with loads at elevation — without proper harnesses — has strong potential to cause serious injury or fatality.
While SIFs are the obvious KPI, incidents that could have caused serious injuries or fatalities are almost as important. A PSIF count indicates your overall safety program still allows uncontrolled hazards that could cause a disaster — they just didn’t this time.
“History has shown repeatedly that most loss producing events (incidents), both serious and catastrophic, were preceded by warnings or near miss incidents,” says the National Safety Council’s case study on near miss reporting systems. “Recognizing and reporting near miss incidents can significantly improve worker safety and enhance an organization’s safety culture.”
Yet, there’s no regulatory requirement to record near misses or PSIFs. That means utilities need to take it upon themselves to track this KPI. Like TRIR, though, tracking all near misses draws a false equivalency between superficial injuries and SIFs. To stay ahead of the life-altering injuries, PSIFs are a better KPI for utilities to watch.
Worker Safety KPI #3: Hazard Identification Rate
SIFs and PSIFs are both vital KPIs, but they are lagging indicators — they identify holes in a safety program, but they do little to get ahead of the problems.
Urbint’s Senior Director of Product Management Kevin Jurica suggests an alternative KPI for utilities: hazard identification rate.
Hazard identification rate is the ratio of hazards a utility worker spots on a job site versus the number of actual hazards they encounter. On average, workers can only identify about 45% of the hazards they come across in the run of a day. That means 55% of hazards are undetectable by workers — possibly until it’s too late.
Increasing hazard identification rate ensures that workers are aware of more workplace hazards, which makes it a crucial worker safety KPI. Fortunately, tools and methodologies exist for improving this number, ranging from energy-based hazard training to AI-powered threat assessment.
“Workers in the field have a lot on their mind and some hazards are more difficult to identify than others,” says Jurica. “Measuring how good workers are at identifying hazards tells you if they are thinking through all of the hazards and not just the obvious ones.“
Worker Safety KPI #4: Controlled High-Energy Hazards
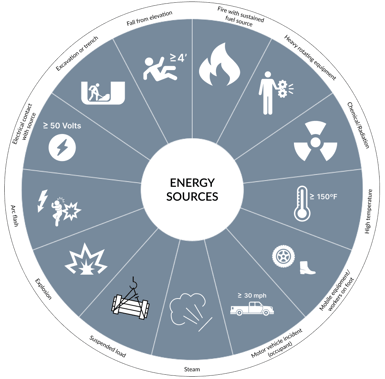 These 13 high-energy hazards have been identified as the source of most SIFs in the utilities.
Beyond identification, utilities also need to apply direct controls to the hazards their workers encounter — especially the high-energy hazards responsible for SIFs and PSIFs.
Dr. William Haddon pioneered the idea that injuries come about from contact between a person and a source of energy. The more energy associated with a scenario, the greater the risk of a SIF. Therefore, any direct controls applied for the high-energy hazards on a utility job site become a strong KPI for worker safety.
“There are a lot of SIFs that can be prevented with direct controls,” says Jurica. “If you can identify those hazards you can implement the appropriate controls, you have a better chance of preventing those events from happening.”
Elimination and substitution of hazards are the two methods of control favored by the National Institute of Occupational Safety and Health. But, the nature of utility work and its combination of trenching, working at elevation, using heavy equipment, and other high-energy activities makes those options challenging.
Still, engineering and administrative controls, along with appropriate PPE, go a long way toward reducing the risk of illness or injury, and stand as a useful KPI for a worker safety program.
Worker Safety KPI #5: Total Recordable Incident Rate (TRIR)
All health and safety professionals in the utilities know their TRIR. The Occupational Safety and Health Administration (OSHA) mandates employers to track and report it as part of their annual illness and injury submissions. (To get the rate, multiply the number of incidents by 200,000 and divide by the total number of hours worked by all employees during the year.)
As a result, TRIR is an old standard KPI for worker safety. It’s a required statistic, but there are problems with relying too heavily on it as a benchmark for your worker safety program.
A Construction Safety Research Alliance paper from 2020 titled “The Statistical Invalidity of TRIR as a Measure of Safety Performance” calls out the issue:
…some argue that TRIR is a poor reflection of safety performance because it does not account for the actual or potential severity of an incident (Toellner 2001). For example, a four-stitch cut to the finger is counted in the same way as a fatality, and a near miss with the potential to be fatal is not in the TRIR metric at all. Others point out that TRIR is reactive in nature as it only counts incidents and does not consider the underlying safety program (Lingard et al. 2017; Lofquist 2010; Salas and Hallowell 2016).
Other common measurements, such as days away from work, restricted, or transfers (DART), suffer the same problem. A sprained ankle that requires modified duties for a week gets lumped in with SIFs.
“TRIR is a metric on the number of injuries, not the relative impact to human life,” says Preston. “Obviously, SIFs are the ones that are going to change how someone lives.”
Ultimately, TRIR is still an important worker safety KPI for utilities. But, a robust and progressive worker safety program needs to move beyond it to prioritize other KPIs — especially leading indicators.
Worker Safety KPI #6: The Right Leading Indicator for Your Unique Safety Challenges
Good safety programs use a combination of lagging and leading indicators to judge their overall performance. Lagging indicators like SIFs and TRIR are well known, but choosing the right leading indicator for your safety program is much more individual.
Many different leading indicators link to ultimate safety outcomes. The Campbell Institute’s Practical Guide to Leading Indicators lists dozens of metrics that have improved safety for companies like Cummins and Honeywell:
- Number of on-the-job observations from employees;
- Number of risks mitigated or controlled;
- Number of facilities running 10% overtime;
- Dollars spent per year on training;
- Number of page views of safety blog;
- Number of off-the-job observations from employees; and
- …many more.
Likewise, The Interstate Natural Gas Association of America lists frequency of safety observations, frequency of Job Safety Assessments, and frequency of client walkthroughs among their set of leading safety indicators.
“Companies need to have the right kind of culture to encourage good safe performance. If you’ve got a really good safety culture, workers start the day with good safety habits and leaders are supporting them. It’s ingrained,” says Jurica. “That's part of why you see a mixed bag of leading indicators. … A lot of metrics are tied to your company’s culture and how well you’re doing day-to-day to create the environment where work can happen safely.”
“That’s something Urbint focuses on,” says Preston.” We’re helping companies develop a balanced safety scorecard for leadership with more predictive leading indicators, as well as orienting around SIFs and PSIFs.”
***
Measuring KPIs is foundational to any safety program. Choosing the above indicators (and narrowing in on the leading indicator for your specific safety priorities) can benchmark your performance and give you the information needed to move closer to a world with zero safety incidents.
Want to learn more about worker safety KPIs and fostering a proactive safety culture? Make sure to register for our webinar, Taking a Proactive Approach to Safety: Improving Outcomes Through Culture and Technology happening July 29.